Overview
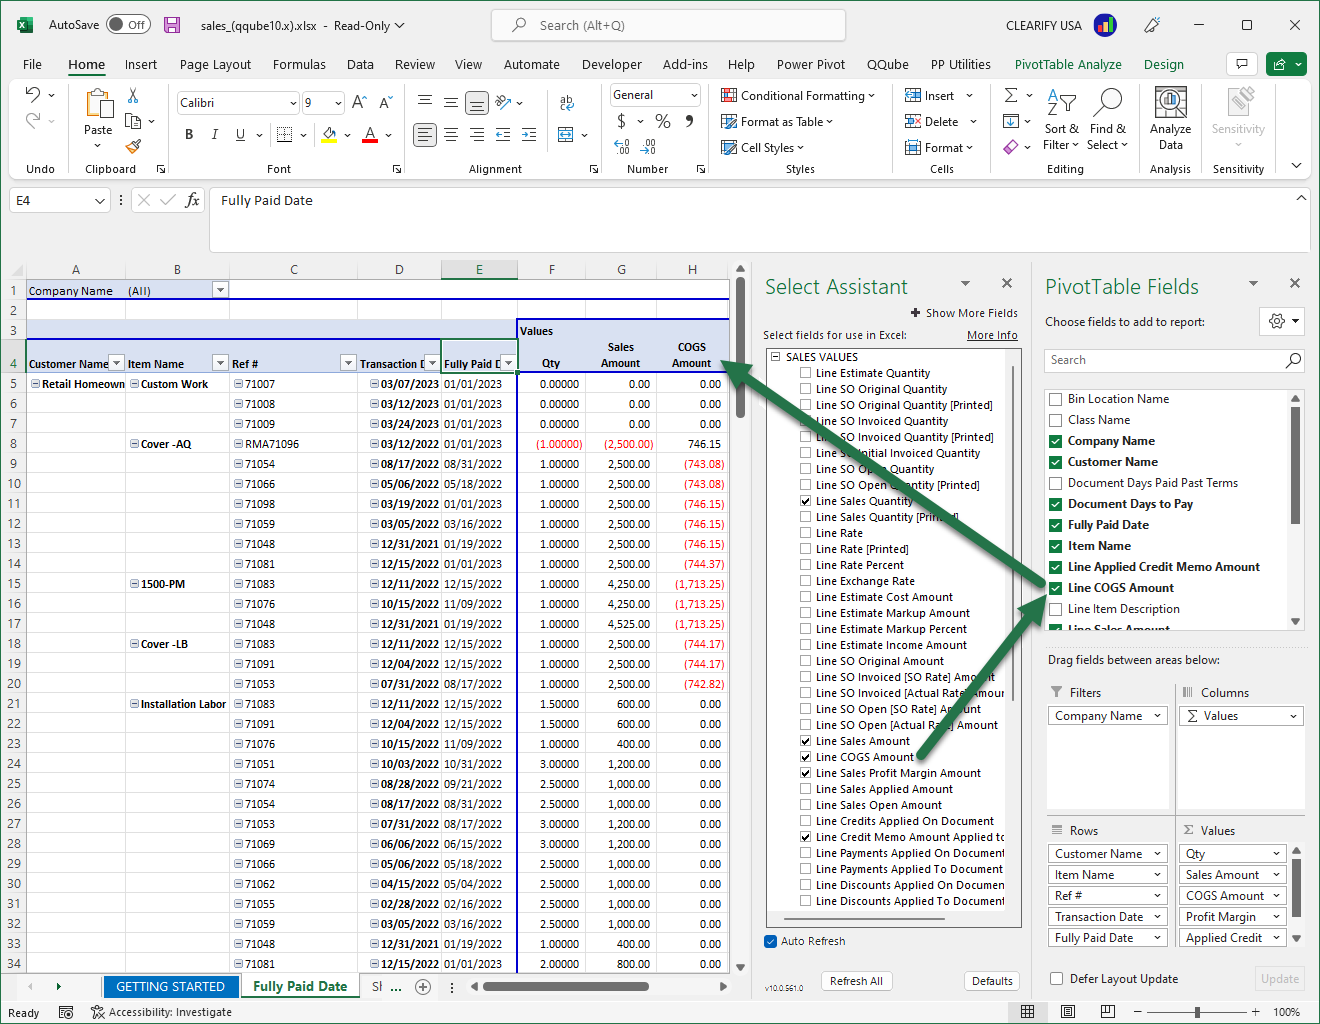
QQube makes it possible to drag and drop QuickBooks fields into Excel by using the Select Assistant from the QQube Excel Add-In.
The Add-In is included with QQube and hides the complexity of working directly with database tables and relationships.
For Advanced Excel Users
The QQube Excel Add-In acts as a front end for Microsoft Query. Advanced users can review and work with the underlying queries when necessary.
Traditional Excel Compared with Database Data
Traditional Excel
Traditional Excel workbooks commonly place manually entered data and formulas in separate cells.
Advanced users may also use array formulas, macros, and VBA to create report-like results.

Excel Connected to a Database
Data returned from a database, including QQube, is not connected to individual, unrelated cells.
Instead, the data is returned as a contiguous block of rows and columns. Sorting or filtering affects the entire data set rather than one isolated cell.

If every database value were retrieved into a separate cell, each cell would require its own query, filter, and dependency. That approach would be impractical for thousands of records.
How QQube Interacts with Excel
The QQube Select Assistant can return data to Excel in two primary formats:
Dynamic Range
A Dynamic Range returns the selected QQube fields as a contiguous Excel list.
The range expands or contracts automatically when the number of returned rows changes.

PivotTable
A PivotTable also begins with fields selected through the QQube Select Assistant.
Creating the report requires two steps:
- Select the fields you want to retrieve.
- Place each field in the appropriate PivotTable area.
Dynamic Ranges Compared with PivotTables
| Feature | Dynamic Range | PivotTable |
|---|---|---|
| Row Changes | Expands and contracts automatically. | Refreshes from the underlying QQube data. |
| Sorting and Filtering | Supports sorting and advanced filtering. | Supports interactive filtering and rearrangement. |
| Subtotals | Excel Data-tab subtotals cannot be added to the dynamic list. | Creates subtotals automatically as row fields are added or rearranged. |
| Best Use | Detailed lists, filtering, formulas, and row-level analysis. | Summaries, grouping, subtotals, and interactive analysis. |
Dynamic Range Limitation
Dynamic Ranges update automatically when the returned row count changes and support sorting and advanced filtering.
However, Excel does not allow the standard Data > Subtotal feature to be applied to the dynamic list.

PivotTable Limitations
PivotTables provide automatic subtotals and are one of the easiest ways to analyze QQube data in Excel.
They have two important limitations:
- You cannot create a calculated column that represents a filtered subset of data. That capability requires PowerPivot.
- Row-label fields, such as Customer, Item, or Account, must appear in the leftmost columns. Measures must appear in the columns to the right.
Advanced Capabilities Beyond Standard Excel
PowerPivot
PowerPivot supports advanced calculations that are not possible in a standard PivotTable.
For example, inventory models can display Quantity on Hand beside sales or consumption measures for multiple date periods.
Power BI
Power BI adds graphical reporting while still supporting traditional rows, columns, tables, and matrices.
Learn more about QQube and Excel PowerPivot.
Learn more about QQube and Microsoft Power BI.
Expected Result
Use the QQube Select Assistant to retrieve QuickBooks data into Excel as either a Dynamic Range or a PivotTable.
Choose a Dynamic Range for detailed row-level work. Choose a PivotTable for summaries, grouping, and automatic subtotals. Use PowerPivot or Power BI when the report requires advanced calculations or graphical analysis.
Was this article helpful?
That’s Great!
Thank you for your feedback
Sorry! We couldn't be helpful
Thank you for your feedback
Feedback sent
We appreciate your effort and will try to fix the article