Overview
Excel provides several PivotTable layout and style options that control how the report is organized and displayed.
These options are available from the PivotTable Tools > Design ribbon when the active cell is inside the PivotTable.

Layout and Style Controls
Layout Options
- Subtotals control whether subtotals appear and where they are placed.
- Grand Totals control whether totals appear for rows, columns, both, or neither.
- Report Layout controls whether multiple row fields appear in separate columns or share one column.
- Blank Rows can insert an empty row after each grouped item.
Style Options
Style options add formatting to the PivotTable, including:
- Color and banding in the report body.
- Formatting for row and column headers.
Subtotals
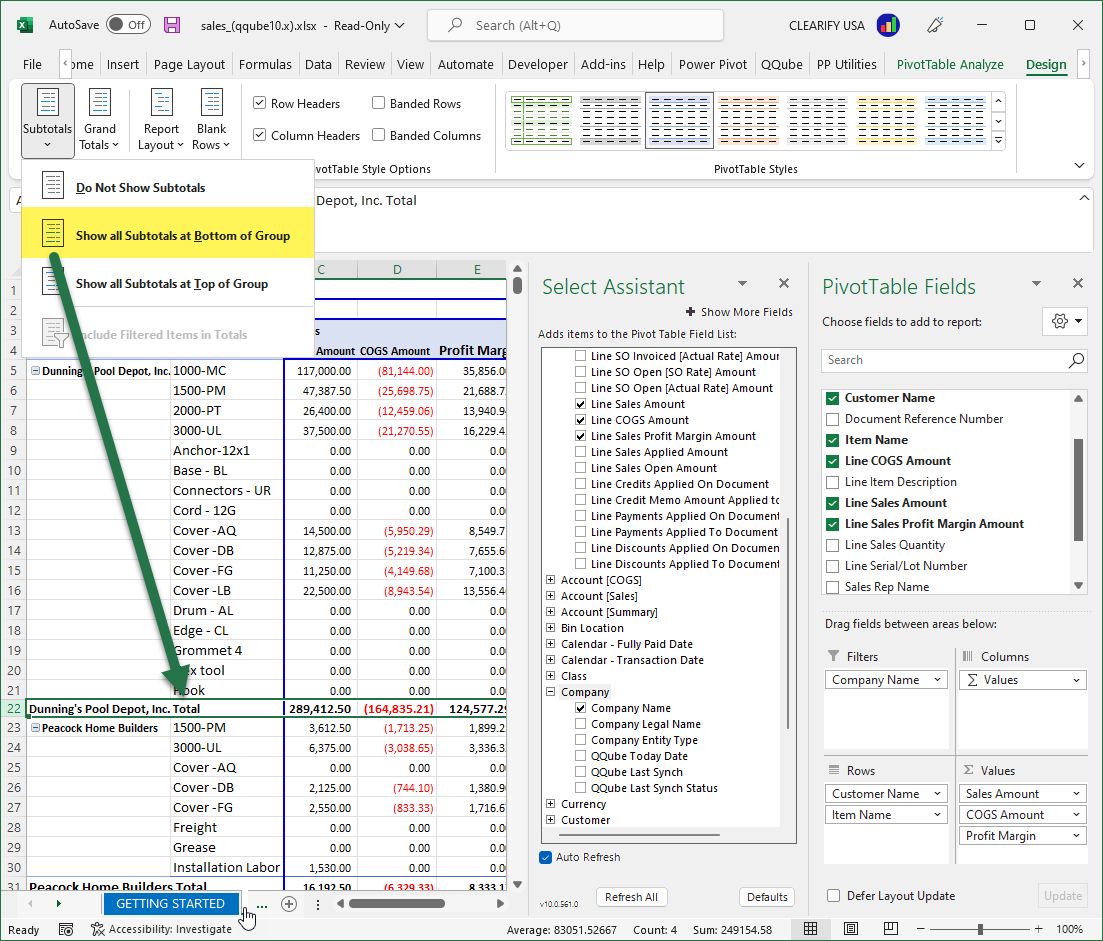
Set Subtotals for the Entire PivotTable
Use Subtotals on the Design ribbon to control subtotal placement globally.
Set Subtotals for One Field
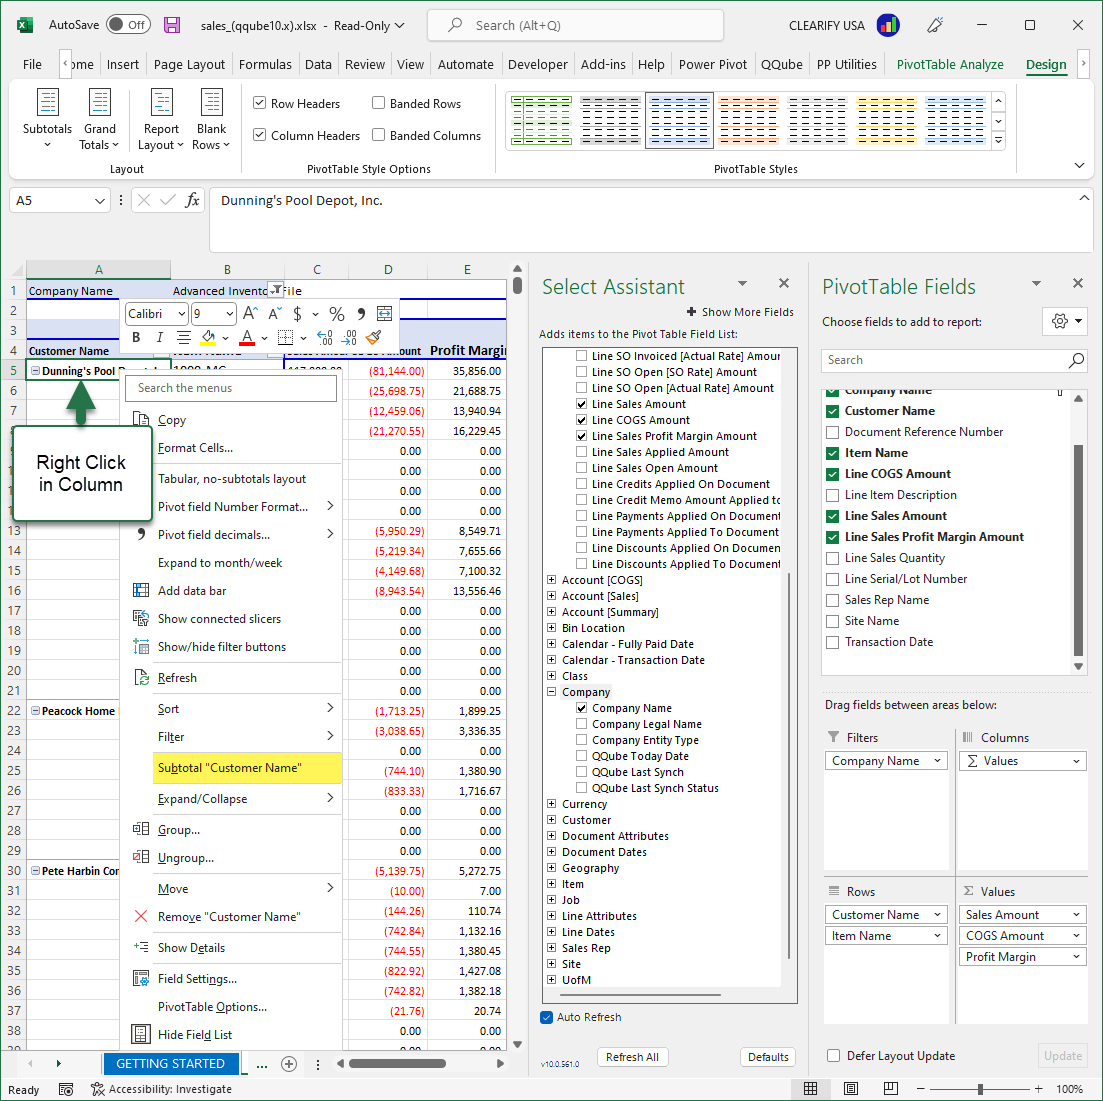
To control subtotals for one specific row field, right-click a cell in that field and open its field settings.
Grand Totals
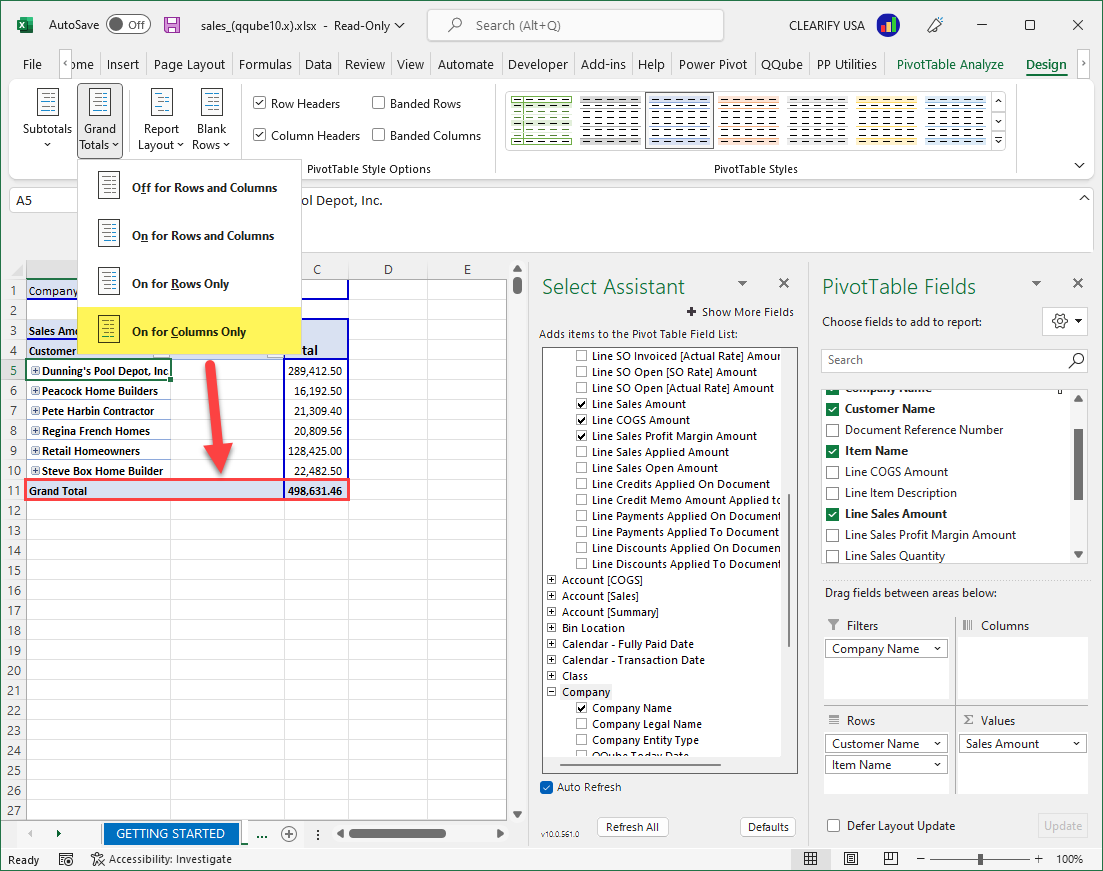
Use Grand Totals on the Design ribbon to display totals for rows, columns, both, or neither.
Financial Summary Reports
Turn off PivotTable grand totals for QQube Financial Summary reports. Those reports already contain their own financial statement totals.
Report Layout
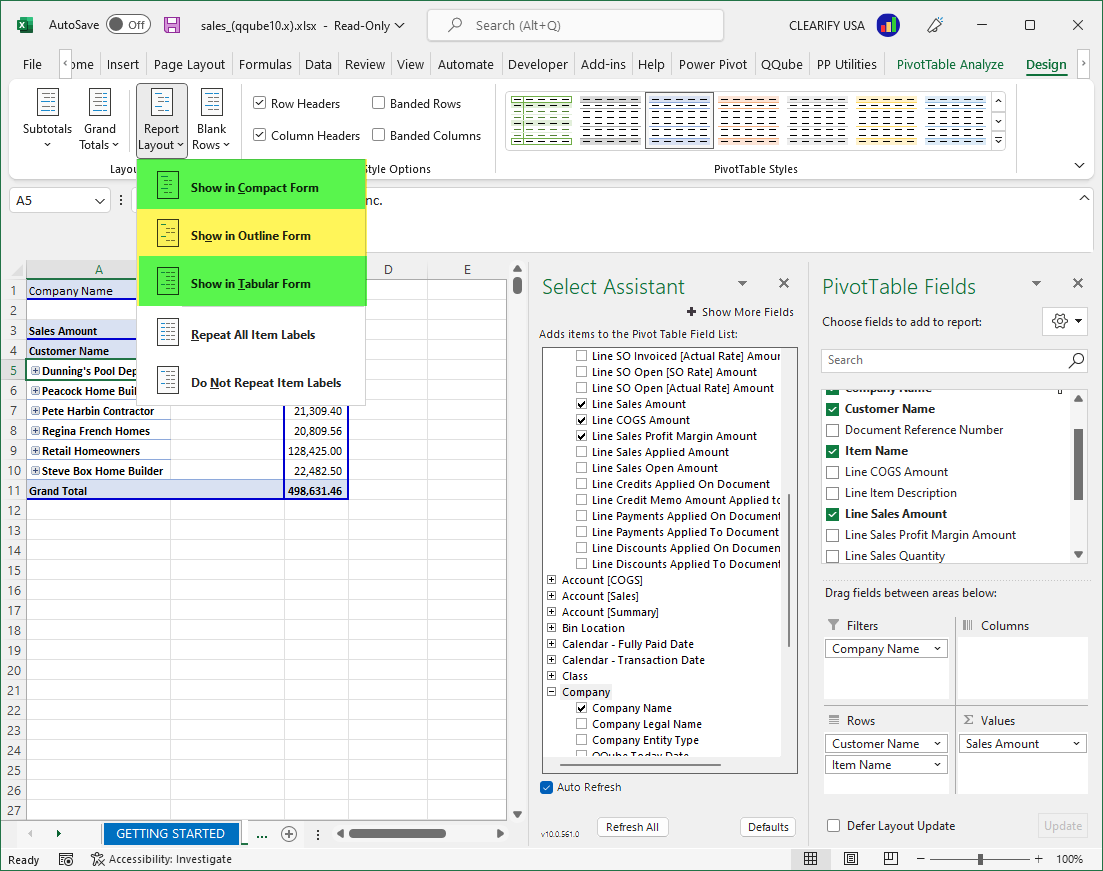
Excel provides three report-layout options. The two most commonly used with QQube are:
- Show in Tabular Form
- Show in Compact Form
The Design ribbon is available only when the active cell is inside the PivotTable.
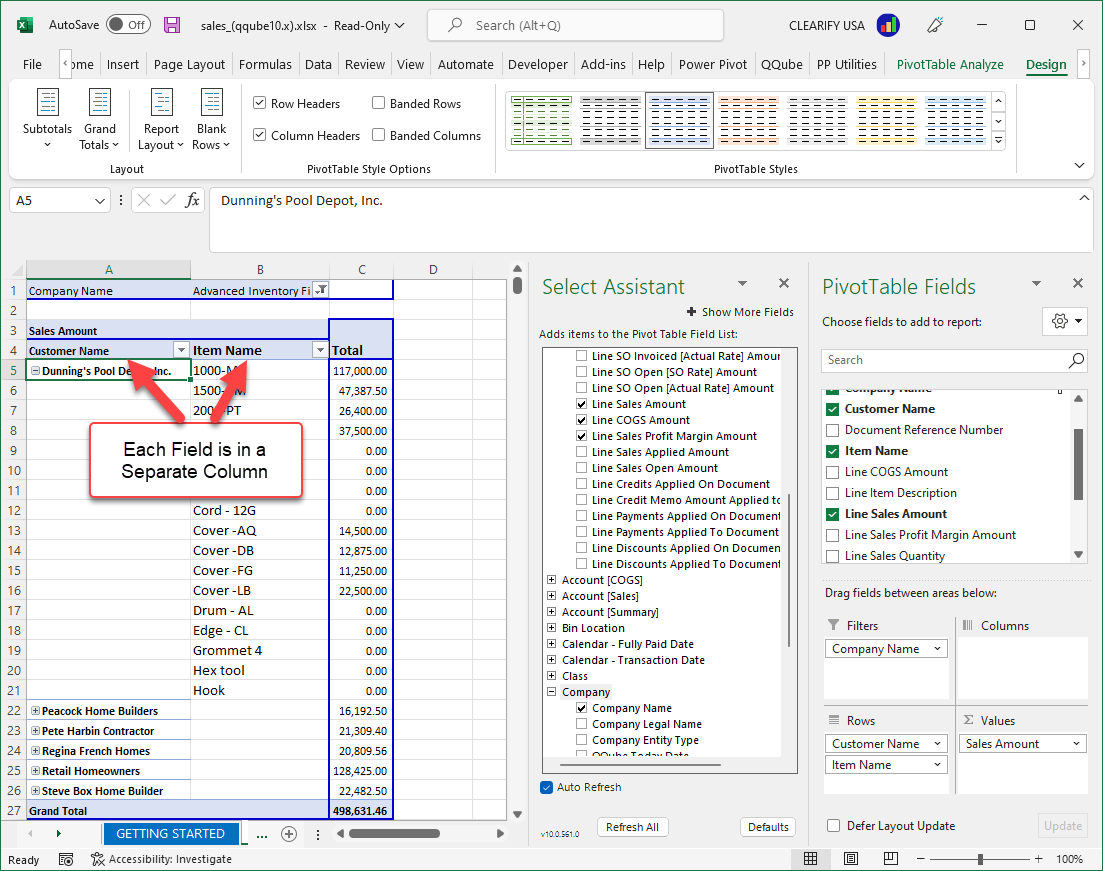
Tabular Form
Best for: QQube detailed data models.
Tabular Form places each row field in a separate column. This makes detailed records easier to read, sort, export, and compare.
Compact Form
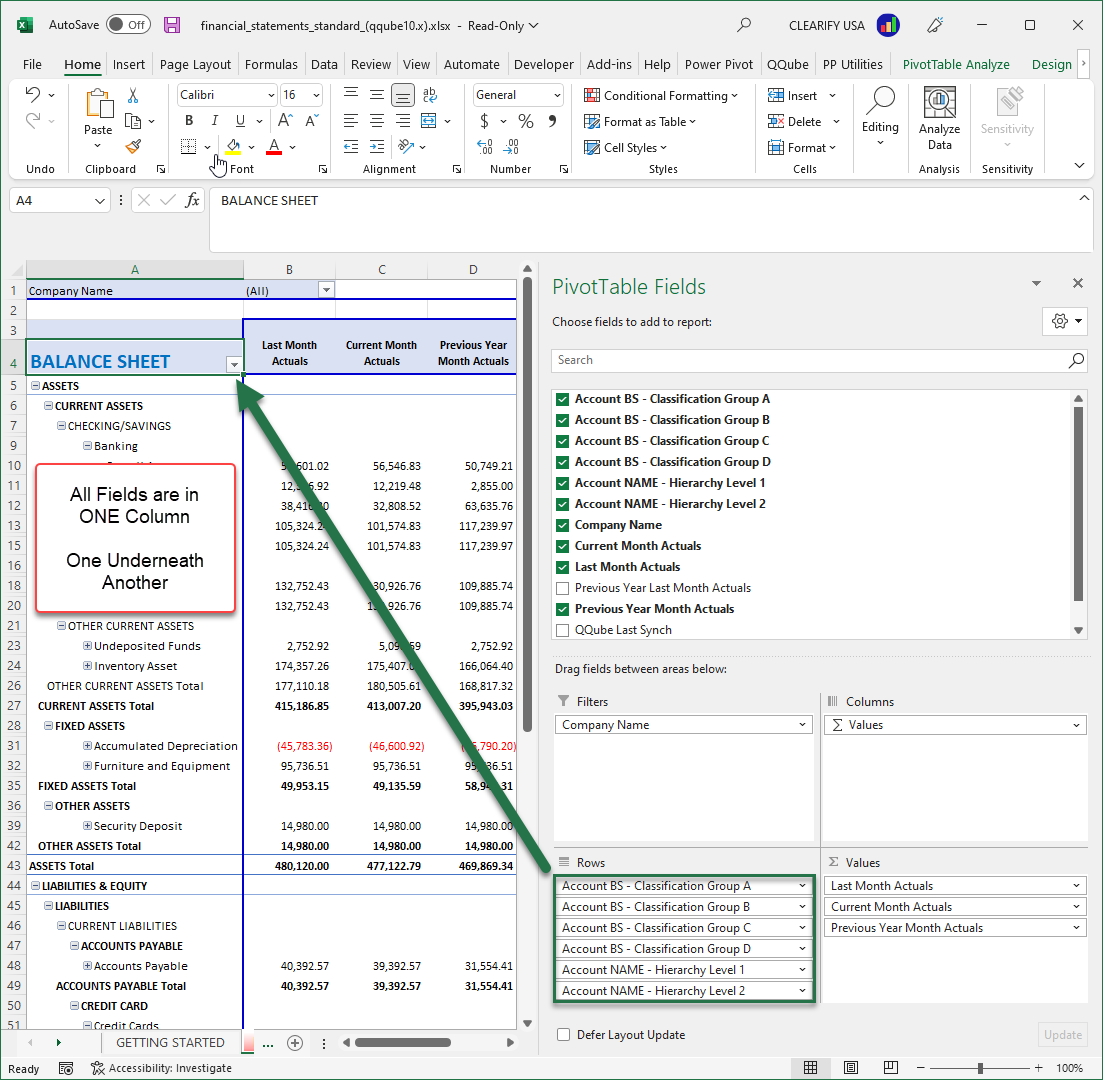
Best for: QQube Financial Summary reports.
Compact Form places multiple row fields in the same column. This produces a condensed, indented hierarchy that works well for financial statements.
Style Options
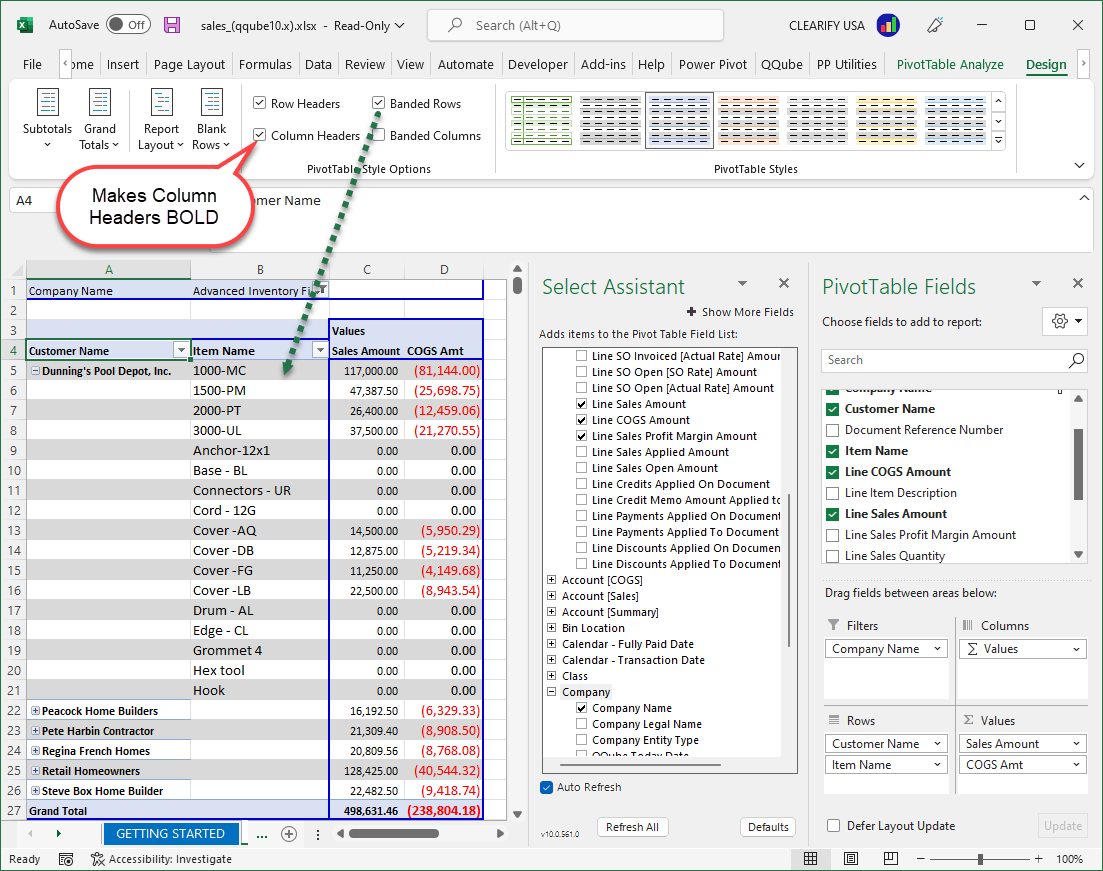
Use the PivotTable Style Options to control the visual formatting of the report.
Common choices include:
- Row Headers to emphasize row labels.
- Column Headers to emphasize column labels.
- Banded Rows to apply alternating row shading.
- Banded Columns to apply alternating column shading.
Recommended Layout by Report Type
| Report Type | Recommended Layout |
|---|---|
| Detailed QQube Reports | Tabular Form, with fields in separate columns. |
| Financial Summary Reports | Compact Form, with PivotTable grand totals turned off. |
Expected Result
Use the Design ribbon to control subtotal placement, grand totals, report structure, blank rows, header formatting, and banding.
Select Tabular Form for detailed reports and Compact Form for Financial Summary reports.
Was this article helpful?
That’s Great!
Thank you for your feedback
Sorry! We couldn't be helpful
Thank you for your feedback
Feedback sent
We appreciate your effort and will try to fix the article