Overview
QQube is designed to let Excel perform the reporting and visualization work. However, financial statements require additional handling because of the way their account hierarchy, signage, and spacing must be represented in a spreadsheet.
The QQube Excel Add-In therefore includes formatting controls specifically for supported financial data models.
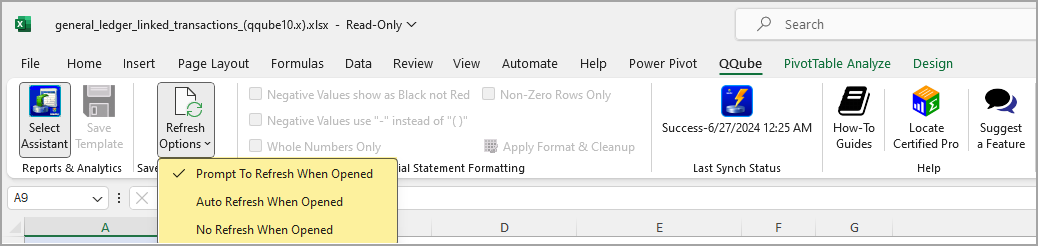
Available formatting options
Black or Red Negative Values
Display negative values in black instead of the default red.
Minus Sign or Parentheses
Display negative values with a minus sign instead of the default parentheses.
Decimals or Whole Numbers
Display whole numbers instead of the default decimal format.
Display Only Non-Zero Rows
Hide rows where every selected analytic column contains 0.00.
Presentation Cleanup
Apply the selected formatting options and clean up the appearance of supported financial statements so the QQube data structure is presented more naturally in Excel.
Supported data models
The formatting controls are available in Excel and Excel Power Pivot for the following QQube data models.
QuickBooks Pro, Premier, and Enterprise
- Profit and Loss
- Profit and Loss by Class
- Balance Sheet
- Balance Sheet by Class
- Profit and Loss Detail — formatting is not available in Excel Power Pivot.
QuickBooks Enterprise only
- Profit and Loss - Actual/Budget/Forecast
- Profit and Loss - 52/53 Tax Year
- Profit and Loss by Class - Actual/Budget/Forecast
- Profit and Loss by Class - 52/53 Tax Year
Presentation Cleanup
Presentation Cleanup prepares supported QQube financial statements for a more natural Excel presentation.
Hide Blank Hierarchy Rows
Hide blank rows created by multi-level orphan accounts. These can occur when some top-level accounts have subaccounts and others do not, causing an unwanted (blank) label to appear.
Remove Financial Grouping Prefixes
Remove the prefixes QQube uses to maintain the correct financial-statement order. For example, a prefix may be used to place Income before Cost of Goods Sold.
Correct COGS and Expense Signage
Reverse the signs used for Cost of Goods Sold and Expense values so the displayed statement matches conventional financial-report presentation.
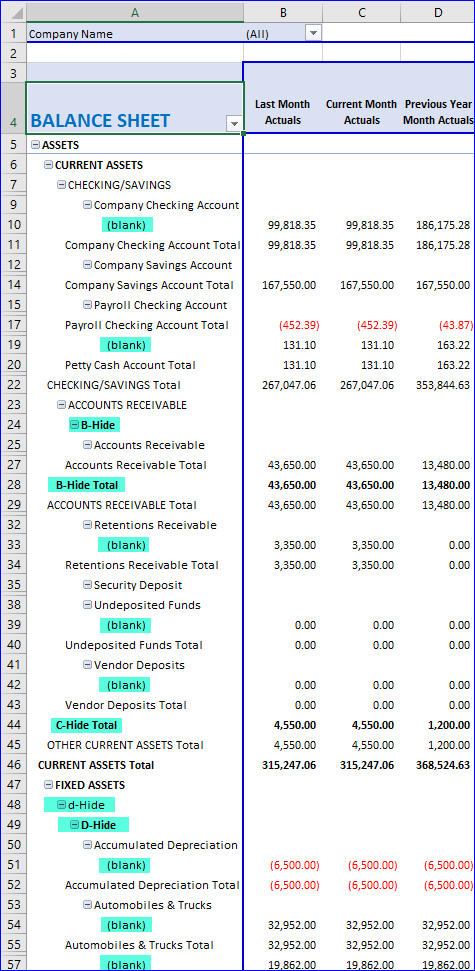
Before Presentation Cleanup
The raw QQube financial data retains the structural values needed to maintain hierarchy, order, and calculation behavior.
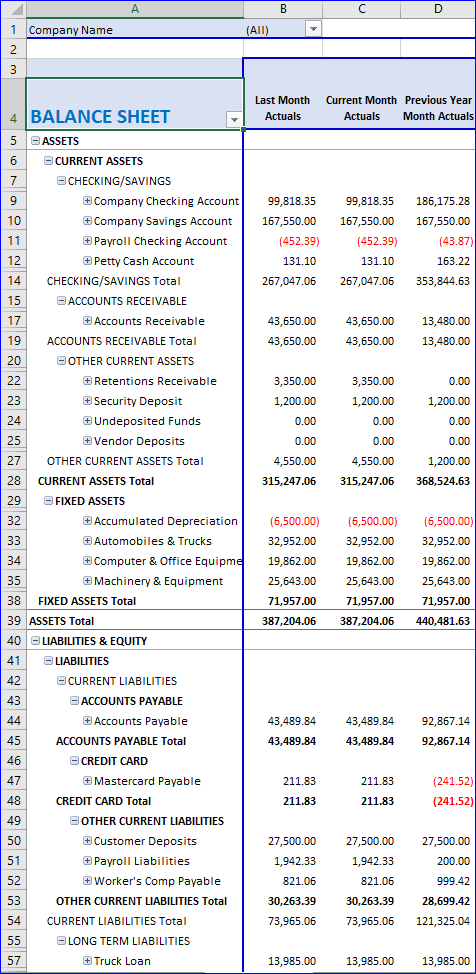
After Presentation Cleanup
The same data is reorganized and reformatted for a cleaner financial-statement presentation.
Expected result
The selected formatting options are applied, zero-only rows can be hidden, and Presentation Cleanup removes structural artifacts that are necessary for QQube processing but undesirable in the finished financial statement.
Was this article helpful?
That’s Great!
Thank you for your feedback
Sorry! We couldn't be helpful
Thank you for your feedback
Feedback sent
We appreciate your effort and will try to fix the article